


 Review: I Love the Giant OLED Display, but Am Less Enamored With the Oversize Touchpad")


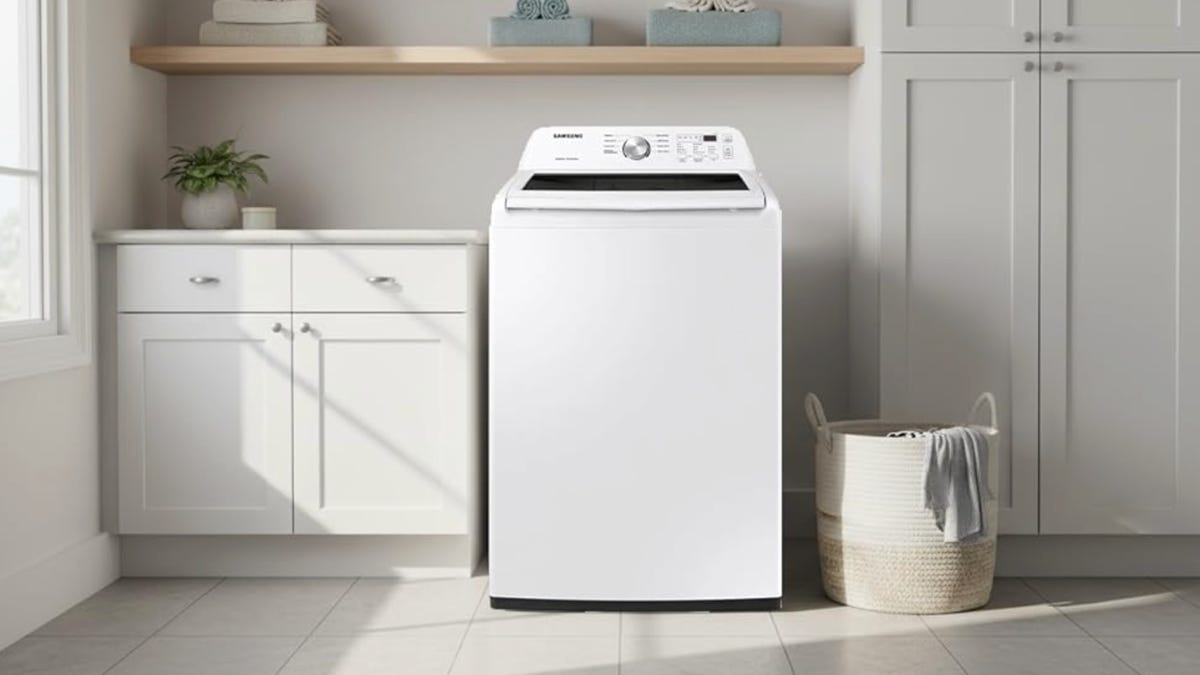
When I compiled over 15,000 data points for CNET’s list of the best washing machines, I didn’t expect to see such a strong case for front-load washers being better long-term investments than top-load washers.
I knew there had to be more to the story, so I dug deep into the data to see how long it takes for a pricier — yet very efficient — washer to offset the lower price of a top-loader through energy savings alone. In other words, the payback period.
The average payback period for front-load versus top-load is 6.5 years. This means front-load washers — which last an average of 12.6 years — are generally the best way to save money long term. Now that this anticlimactic fact is out of the way, let’s see how practical it is with CNET’s entire washing machine lineup.
Armed with pricing, efficiency and utility rate data, I’ve calculated the payback period for the top washer pick, Electrolux ELFW7738A, compared with every other product in the lineup — plus a notable top washer that didn’t make the list.
But why is this Electrolux model a prime candidate for my baseline? It’s simply the most efficient washer in my dataset and on our best list. Let’s jump in to see how it stacks up.
How I did the math: Collecting data and calculating the payback period
I collected almost all of this baseline data in June 2025, ahead of my comparison of the best washers — this includes Energy Star information and most retail prices. However, the retail prices for the models below are current as of January. Here are the statistics behind the math.
|
Model number |
ELFW7738A |
WA45T3200AW |
WT8200C |
NS-WMT41WA5 |
GFW550SSNWW |
WT7250C |
MHW5630 |
WFW4720RW |
|
Load configuration |
Front |
Top |
Top |
Top |
Front |
Top |
Front |
Front |
|
Retail price |
$1,099 |
$579 |
$749 |
$500 |
$866 |
$729 |
$749 |
$699 |
|
Capacity |
4.5 cu. ft. |
4.5 cu. ft. |
5.0 cu. ft. |
4.1 cu. ft. |
4.8 cu. ft. |
5.0 cu. ft. |
4.5 cu. ft. |
4.5 cu. ft. |
|
Water usage |
3,452 gallons/yr. |
8,552 gallons/yr. |
6,330 gallons/yr. |
7,856 gallons/yr. |
4,239 gallons/yr. |
4,720 gallons/yr. |
4,267 gallons/yr. |
4,248 gallons/yr. |
|
Water costs |
$58.10/yr. |
$143.93/yr. |
$106.53/yr. |
$132.22/yr. |
$71.34/yr. |
$79.44/yr. |
$71.81/yr. |
$71.49/yr. |
|
Electricity usage |
74 kWh/yr. |
240 kWh/yr. |
120 kWh/yr. |
186 kWh/yr. |
158 kWh/yr. |
110 kWh/yr. |
128 kWh/yr. |
140 kWh/yr. |
|
Electricity costs |
$12.21/yr. |
$39.60/yr. |
$19.80/yr. |
$30.69/yr. |
$26.07/yr. |
$18.15/yr. |
$21.12/yr. |
$23.10/yr. |
- To calculate water costs, I divided the Energy Star water usage figures by 1,000, then multiplied the result by $16.83. The EPA’s WaterSense report says this was the national average rate for Combined Water & Wastewater in 2024. (This covers the water a washer uses and the sewer rates to remove it.)
- For electricity costs, I used the November 2024 national average from the US Energy Information Administration (Table 5.6.B). This report updates monthly, but the Residential value as of my analysis was $0.165 per kilowatt-hour.
- WaterSense’s report doesn’t provide state-level water-pricing data, so the electric prices reflect only the national average, not individual states. Check out my analysis on fridge efficiency to see how location affects electricity rates.
- I combine overall electricity and water costs into the operating costs used for the payback period calculation.
Calculating the payback period is pretty simple
(Efficient washer price – Standard washer price) / (Standard washer annual operating costs – Efficient washer annual operating costs) = Payback period (in years)
This tells you how many years it will take to pay off the extra cost of the efficient model. If the number is negative, the efficient machine will be cheaper upfront. Likewise, the closer a positive payback period is to the average lifespan of a washing machine (12.6 years according to the Journal of Cleaner Production), the less worthwhile it is.
Generally, any washer with a payback period of less than seven years is probably a good investment. Still, you’ll see the biggest savings when two appliances with similar prices have vastly different efficiency.
Filling gaps in the data
Some of the models I evaluated for the washing machine lineup aren’t in the Energy Star database because they aren’t certified — chiefly the Samsung WA45T3200AW and Insignia NS-WMT41WA5. I added their usage data manually. In Samsung’s case, it’s as easy as copying the specs from its product page.
However, Best Buy doesn’t list an annual water usage figure for the Insignia model, so we’ll need to take a more indirect approach. To calculate Insignia’s water usage, I looked it up on the California Energy Commission’s Modernized Appliance Efficiency Database System, which lists it as 26.63 gallons per wash cycle.
Then I multiplied it by 295, which the Code of Federal Regulations lists as the average number of cycles in a year — Energy Star data uses this number. The grand total for Insignia NS-WMT41WA5 is roughly 7,856 gallons per year. Notably, this was the only spec I needed to calculate manually for my analysis.
Electrolux’s payback periods across the washer lineup
Let’s start with Electrolux versus the average washer in each category. Because I didn’t have enough time to update every retail price behind the overall averages in this analysis, it’s not as reliable as the more recent price data I collected for individual washer models. Still, I compared recent Home Depot prices to ensure that my older data wasn’t too outdated.
Compared with the average top washer, Electrolux costs roughly $348 more, while operating costs are $53 lower per year. Dividing $348 by $53 yields a payback period of 6.5 years, which is fairly respectable given an average appliance lifespan of 12.6 years.
In theory, this means that the Electrolux model would spend just under half its estimated lifetime making up for the higher purchase price — it’s all unvarnished savings after that.
|
Number of models |
– |
246 |
95 |
|
Retail price |
$1,099 |
$751 |
$993 |
|
Water usage |
3,452 gallons/yr. |
5,800 gallons/yr. |
4,064 gallons/yr. |
|
Electricity usage |
74 kWh/yr. |
156 kWh/yr. |
109 kWh/yr. |
|
Water costs |
$58.10/yr. |
$97.62/yr. |
$68.39/yr. |
|
Electricity costs |
$12.21/yr. |
$25.82/yr. |
$17.97/yr. |
|
Total operating costs |
$70.31/yr. |
$123.44/yr. |
$86.36/yr. |
|
Payback period (vs Electrolux) |
– |
6.5 years |
6.6 years |
Surprisingly enough, the average front washer has a similar payback period to top washers when compared with Electrolux. This is because the modest yearly operating savings of $16 take much longer to offset a relatively small retail price gap of only $106, compared with the dramatic savings versus top-loaders.
Now let’s narrow this comparison down to Electrolux versus six competitors from the review, plus a bonus top-loader with best-in-class efficiency (LG WT7250C). This includes top washers from Samsung, LG and Insignia — as well as front washers from GE, Maytag and Whirlpool. As I mentioned above, the Samsung WA45T3200AW and Insignia NS-WMT41WA5 lack Energy Star ratings, so they are typical low-efficiency top-loaders.
|
Model number |
ELFW7738A |
WA45T3200AW |
WT8200C |
NS-WMT41WA5 |
GFW550SSNWW |
WT7250C |
MHW5630 |
WFW4720RW |
|
Load configuration |
Front |
Top |
Top |
Top |
Front |
Top |
Front |
Front |
|
Retail price |
$1,099 |
$579 |
$749 |
$500 |
$866 |
$729 |
$749 |
$699 |
|
Operating costs |
$70.31/yr. |
$183.53/yr. |
$126.33/yr. |
$162.91/yr. |
$97.41/yr. |
$97.59/yr. |
$92.93/yr. |
$94.59/yr. |
|
Payback period |
– |
4.6 years |
6.2 years |
6.5 years |
8.6 years |
13.6 years |
15.5 years |
16.5 years |
Electrolux’s best matchups
As you can probably guess, Electrolux compares well with most top-loaders. The Samsung WA45T3200AW and Insignia NS-WMT41WA5 have shorter payback periods than average, despite costing less than half as much. Interestingly, the Energy Star-rated LG WT8200C lags behind Insignia, likely because of its relatively high $749 price tag.
With an 8.6-year payback period, the front-load GE GFW550SSNWW pushes the boundaries of Electrolux’s dominance. In this case, I still think Electrolux is the better long-term investment.
Electrolux’s diminishing returns
Electrolux fares much worse against the final three contenders. The more pleasant surprise is the LG WT7250C. However, I want to note that this is an extreme outlier — many similar top washers also cost more than this model.
I can’t say the same for the Maytag and Whirlpool machines, which meet only the bare minimum front-load requirements to earn Energy Star ratings. This means that the $1,100 Electrolux generally has a shorter payback period than standard front-load units under $800. (That said, it earns the top spot on the list for more than just energy efficiency.)
Electrolux vs. compact washers
Most of the washers in the lineup have a capacity similar to Electrolux’s, so there’s less need to account for drum size. That said, Bosch and Miele compact washers are almost half the size, so it’s not a fair comparison because the Electrolux will always take fewer loads to wash the same amount of clothes.
To account for differences in drum size between these models, I multiplied Bosch and Miele’s operating costs by the number of revolutions required to reach 4.5 cubic feet. It’s mostly a rough estimate for comparison purposes, but it shows that compact washers are best reserved for tight spaces and smaller households that don’t wash as many clothes.
|
Model |
ELFW7738A |
WGB24600UC |
WWD160WCS |
|
Retail price |
$1,099 |
$1,549 |
$1,599 |
|
Water usage |
3,452 gallons/yr. |
2,426 gallons/yr. |
2,467 gallons/yr. |
|
Electricity usage |
74 kWh/yr. |
118 kWh/yr. |
116 kWh/yr. |
|
Operating costs |
$70.31/yr. |
$60.30/yr. |
$60.66/yr. |
|
Capacity |
4.5 cu. ft. |
2.4 cu. ft. |
2.3 cu. ft. |
|
Capacity multiplier |
– |
1.88 |
1.96 |
|
Equivalent operating costs |
$70.31/yr. |
$113.36/yr. |
$118.89/yr. |
|
Total 10-year costs (rounded) |
$1,802 |
$2,683 |
$2,788 |
However, Electrolux’s lower retail price means that the payback period can’t tell the whole story here, so let’s see how the 10-year costs measure up:
- Bosch: Net loss of $881 compared with Electrolux
- Samsung: Net loss of $986 compared with Electrolux
In terms of capacity, Electrolux will always come out on top against these compact units, as their higher retail prices and equivalent operating costs hold them back.
That said, smaller households (with fewer clothes) are better off with a slightly more expensive compact washer. If you don’t account for the volume of clothes, it would take Electrolux 45 years to break even with Bosch and 51.8 years with Miele. Choosing the best washer for your needs doesn’t always mean buying the biggest one.
Electrolux vs washer-dryer combos
Lastly, I didn’t want to leave out the two washer-dryer combos on my washing machine list, so the payback period for these accounts for Electrolux’s paired electric dryer, the ELFE7738AA. (It costs $1,099, the same as the washer.) From there, I calculated the combined annual operating costs for the combos and the Electrolux pair — washing and drying.
|
Model(s) |
ELFW7738A (washer) ELFE7738AA (dryer) |
WM6998H |
Bespoke WD53DBA900HZ |
|
Retail price |
$2,198 ($1,099 + $1,099) |
$2,098 |
$1,999 |
|
Water usage |
3,452 gallons/yr. |
4,235 gallons/yr. |
4,500 gallons/yr. |
|
Water costs |
$58.10/yr. |
$71.28/yr. |
$75.74/yr. |
|
Electricity usage (washing) |
74 kWh/yr. |
99 kWh/yr. |
103 kWh/yr. |
|
Electricity costs (washing) |
$12.21/yr. |
$16.34/yr. |
$17.00/yr. |
|
Operating costs (washing) |
$70.57/yr. |
$87.61/yr. |
$92.73/yr. |
|
Electricity usage (drying) |
620 kWh/yr. |
380 kWh/yr. |
319 kWh/yr. |
|
Operating costs (drying) |
$102.30/yr. |
$62.70/yr. |
$52.64/yr. |
|
Total operating costs |
$172.61/yr. |
$150.31/yr. |
$145.37/yr. |
|
Total 10-year costs (rounded) |
$3,924 |
$3,601 |
$3,453 |
The most interesting thing about these results is that Electrox’s dryer can’t match the energy efficiency of the heat pumps used by LG and Samsung’s combo units. Ultimately, the combo units are better investments — at least in terms of energy usage. Payback period is also tricky here, so let’s examine the total 10-year costs:
- LG: $323 net savings compared to Electrolux
- Samsung: $471 net savings compared to Electrolux
Because they’re more affordable and efficient than the Electrolux pair, these combo units have a head start, and their lead will only increase — provided they have a long service life. Samsung leads in overall energy efficiency and annual operating costs.
While Samsung saves $148 compared with LG, the caveat here is that Samsung saves only $4.94 per year in energy costs. Most of the savings come from the lower purchase price. It’s basically a toss-up. Still, Samsung’s 20-year motor warranty has the edge compared to LG’s 10-year coverage.
Read more: Are You Still Using Bleach? A Laundry Expert Explains Why That’s a Big Mistake
Read the full article here


